
Charles Joseph Minard‘s pioneering and bounteous use of pie charts has always been inspirational. It is no small wonder then that his work is so often cited in the visualization community. Below is a personal favorite with no less than 50 pie charts in one visualization.

Minard’s most famous work, however, is his map of Napoleon’s ill fated march on Russia. Sadly it contains no pies, but still it manages to inform. Information design luminary, Edward Tufte heralds it as “probably the best statistical graph ever drawn.” One of the major considerations in his argument is the number of information carrying variables that are displayed. He states: “Minard’s graphic tells a rich, coherent story with its multivariate data, far more enlightening than just a single number bouncing along over time. Six variables are plotted: the size of the army, its location on a two-dimensional surface, direction of the army’s movement, and temperature on various dates during the retreat from Moscow.”
This lead me to wonder, could a variation of the superlative pie chart compete with Minard’s six variables? As such, I would like to introduce to you the marvel that is 3D Stacked Scatter Pie Columns.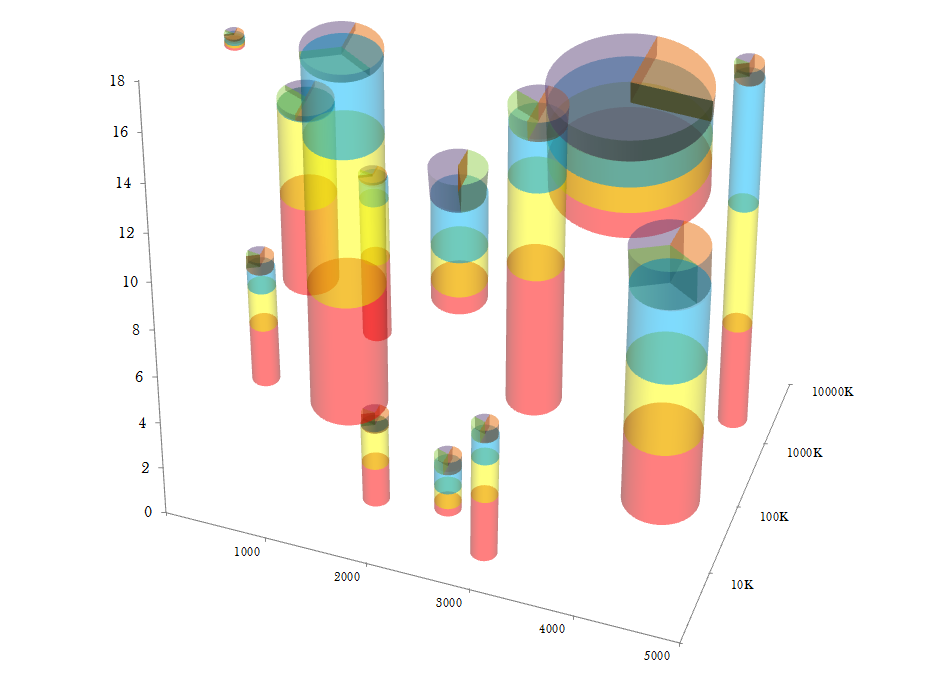
No fewer than seven information packed variables can be plotted in this new chart form: Three conveyed by position along the x-axis, y-axis and z-axis. Another two by the columns’ length and width. The size of the the stacks within the column along with the conventional partitions of the pies atop the columns round out our seven variables.
We could consider adding opacity as another information carrying variable, but we must be careful not to take things too far, and in this case I think opacity is better used to help address issues with occlusion.
As with Minard’s chart, at first this new form might feel overwhelming, but I tend to agree with Alberto Cairo on finding “a balance between novelty and tradition” (as outlined in Evan Sheehan‘s excellent guest post on Alberto’s blog). I think this graph elegantly executes that balance, bringing many traditional elements into one exciting new graphical form.
One further advantage to this method is that we are not limited to plotting geographical data on our xy plane, which, while technically two variables (latitude and longitude), feels more like one (location).
It’s not every day that you can best someone as august and antediluvian as Minard, but I think few will disagree with the obvious merits and preeminence of this new graphic form.