
Visualization is the visual communication of information, and there is one form that communicates more precisely, effectively, efficiently, engagingly, and creatively than all others. This site is devoted to the most versatile, robust and wonderful of all information visualization mechanisms: the pie chart.
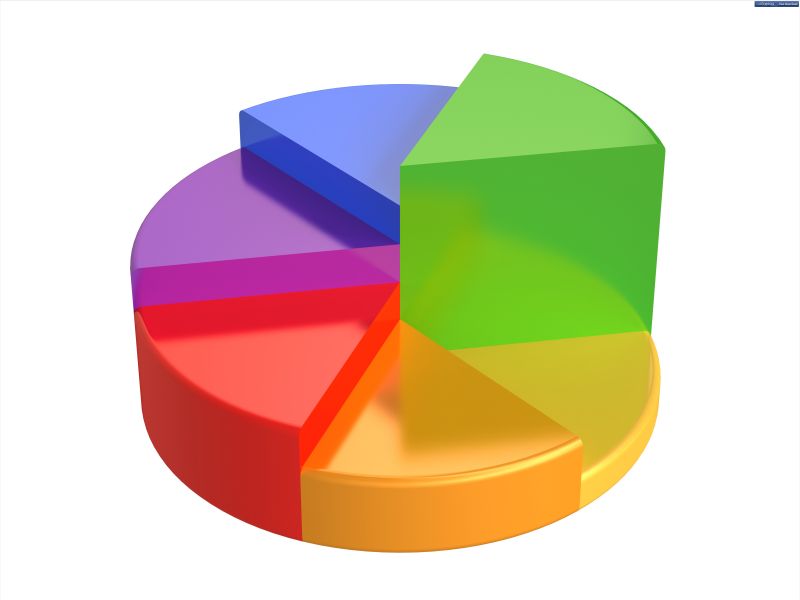 The featured image for this first post (which, coincidentally, is the first image provided in a google search for pie chart), is a fitting metaphor for our climb to new visual heights as we explore the power of pie. In this blog I will endeavor to convey the subtle genius inherent in William Playfair’s most stimulating and underappreciated creation. We will explore its range and depth, but beyond that we will learn how to extend and expand its capabilities and uses. There are new realms waiting for the application of pies and new pies (as well as some underused old ones) waiting to be applied.
Let’s shake up visualization. Let us not be satisfied with the limited number and variety of pie charts in use, instead may a hundred flowers blossom, or better yet a thousand pies bake, in our collective, visual, interactive, and of course metaphorical ovens.